PPC advertising is a powerful tool to add to your marketing strategy. It is a carefully targeted approach that helps you reach more relevant, qualified prospects. However, if you don’t have a solid plan surrounding PPC reporting, it will be difficult to make full use of your data and results. To ensure your efforts don’t go to waste, you need your analytics to be as concise and easy to follow as possible. What should you report -and how? This guide will help you create and present more concise, accurate, and actionable PPC reports.
Understand Your Metrics and PPC Goals
What do all the facts and figures actually mean? Unless you know the answer to that question, you can’t compile useful reports on your pay-per-click results. First, determine your goals. These will depend on the industry you are running ads for, as well as the specific business goals of each company. Next, know all the metrics and learn to interpret them. You can then match the data to your goals and decide where the mark is being hit -and where it isn’t. The primary metrics include:
- Bounce rate.
- Time spent on site.
- Reach.
- Impressions.
- CPM (cost per “mille” impressions, AKA cost per thousand).
- Clicks.
- CPC (Cost Per Click).
- Views.
- CPV (Cost Per View).
- New user conversions.
- New user conversion rate.
- New user average CPA (Cost Per Action).
- New user ROAS (Return On Ad Spend).
- ROAS (Return On Ad Spend).
- Transactions.
- Sales.
- ROI (Return On Investment),
For long-term campaigns, you need to consider metrics such as:
- Overall campaign metrics.
- Cost per campaign.
- Device performance.
- Channel performance.
- Best-performing keywords and ads.
- Lessons learned for future campaigns.
Add Context
Now, you need to be able to read those metrics and explain them. What do the numbers mean in the context of a client’s marketing goals? What do the results say about the success of your marketing campaigns? How can they drive adjustments to increase the efficacy of your marketing efforts? Include a summary that briefly explains all the variables and what they mean.
Develop a Template
Having a template that you can use to report across all of your campaigns will make your job easier and increase efficiency and consistency. It also improves your professional profile, as you are able to deliver a detailed, standard document with all Ts crossed and Is dotted. You may also choose to create your own template using Excel or Google Docs. There are also some excellent online tools that will facilitate the drafting of templates, such as ReportGarden, Supermetrics, and TapClicks.
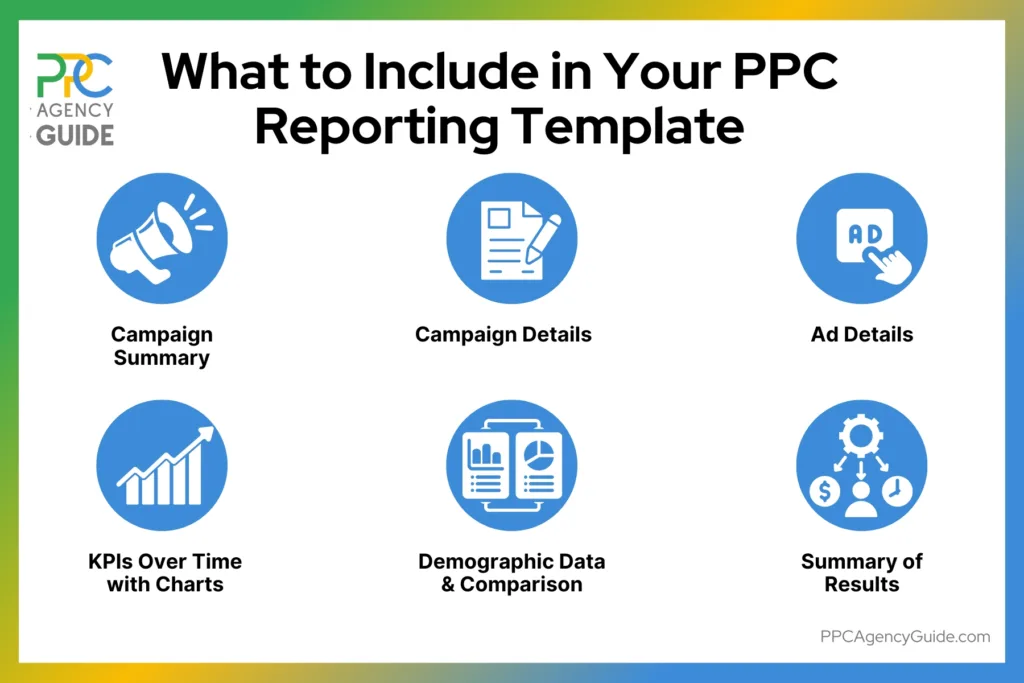
A typical template could be laid out as follows:
- Campaign summary.
- Specific campaign details.
- Specific ad details.
- Charts representing performance over time for valuable KPIs.
- Demographic data and comparison.
- Summary.
Ultimately, as you become more familiar with your tools and metrics, as well as your clients’ goals, you can – and should – develop templates tailored to your specific needs. They should be unique documents that reflect your brand service offering and lay out information in a manner that is best suited to you and your clients’ needs. Good PPC reporting is an essential part of any successful online advertising venture, and it is relatively easy to get right if you just follow these basic guidelines.
FAQs About PPC Reporting
What key metrics should I include in a report?
Essential metrics include click-through rate, quality score, cost per click, conversion rate, and return on ad spend. Focus on the metrics that align with your marketing goals, such as campaign performance across different ad groups and landing page effectiveness. Detailed reports provide performance data that reveal advertising trends and help optimize your campaigns. Track performance using metrics like impressions, conversions, and customer journey data to gain comprehensive insights.
What's the best way to streamline the reporting process?
Use a reporting tool or software to automate manual reporting and create consistent dashboards. Tools like Google Ads' built-in features help track performance efficiently across multiple paid campaigns. A good dashboard consolidates data from various advertising platforms, including Bing Ads, giving you deeper insights into campaign performance. The right reporting strategies save time while delivering comprehensive views of your efforts and advertising spend across all channels.
How often should I create reports?
Create reports based on your needs and campaign duration. Monthly reports work well for tracking overall performance and long-term trends, while weekly reports help optimize active campaigns quickly. Every campaign benefits from regular performance reviews. Consistent reporting helps identify what's working, adjust your budget allocation, and respond to performance changes across paid search channels. Regular reports show patterns that inform strategic adjustments for better results.
What makes an effective report?
An effective report balances comprehensive metrics with clarity. Include key performance indicators relevant to your goals, comparative data showing performance across time periods and channels, and actionable insights that guide optimization decisions. Reports help stakeholders understand campaign effectiveness without overwhelming them. Strong reporting emphasizes context—explain what the data means for your marketing efforts and how it drives decisions to improve your paid advertising performance.