
Do you ever wish you could look into the paid advertising accounts of your competitors to see how you stack up? Or, have you ever looked at a sea of PPC metrics and wondered what “good” really is? PPC benchmarks provide you with this level of clarity.
On this page, you’ll learn which metrics matter when benchmarking, see average rates for all industries across them, and get industry-specific PPC benchmarks so it’s easy to see where you stand.
Why PPC Benchmarking Matters
PPC benchmarking is the process of comparing your paid advertising results to other businesses like yours. This makes it easier to see if your ads are performing as they should. It’s the first step in maximizing your ROI and can help you understand if there are deficiencies in your PPC strategy and where they might be.
It’s easy to see the benefit of this when a business offers products or services online. The number of people who find you and become customers may hinge entirely on your online ads. However, more than three-quarters of local smartphone searches now result in a person visiting a business within 24 hours, according to Google. Benchmarking is crucial for brands that want more foot traffic, too.
Average PPC Benchmarks Across All Industries
Because most businesses are comparing Google Ads and Microsoft Advertising, this page will focus on these two ad platforms. Most statistics relate to search ads, which are paid advertisements that appear alongside organic search results on search engines like Google and Bing. However, you’ll also see some data on display ads to provide context.
Cost Per Click (CPC)
Ad platforms hold auctions to determine which ads are displayed and where they appear. Each platform has a propriety algorithm that considers factors such as your bid and how it compares to the bids of competitors, the quality of your ad, and how likely your ad is to meet the user’s needs. Your brand is charged a fee only when your ad is displayed, the user clicks it, and the amount you pay is referred to as your cost per click, or CPC.
A lower CPC is better. The less you pay for each click, the more clicks and potential customers you can connect with without breaking your budget.
CPC Benchmarks
Average CPC varies widely by industry. For instance, the legal industry has historically had the highest average CPC. Lawyers pay around $9.21 each time someone clicks on their ad. Conversely, real estate usually has one of the lowest average CPC rates. Agents pay around $1.55 each time someone clicks their ad.
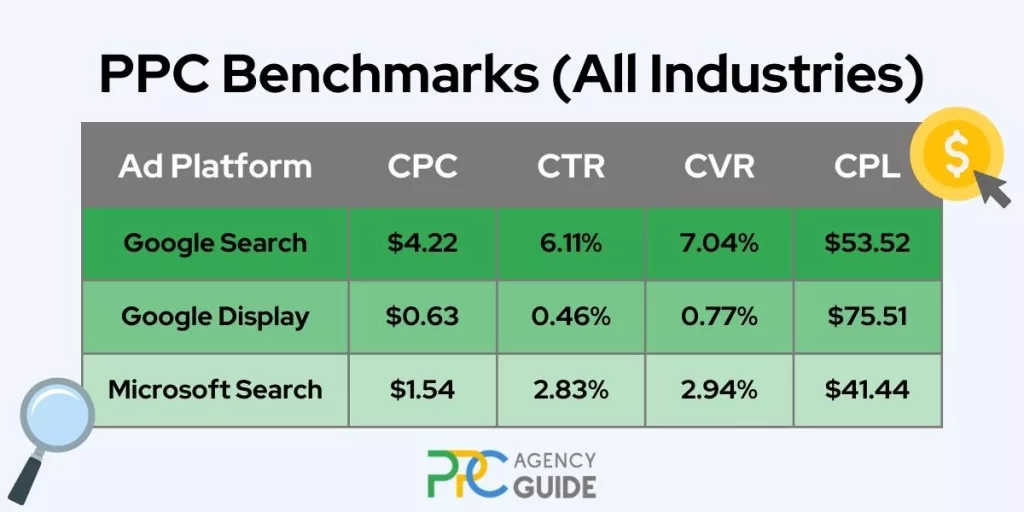
Across all industries, average CPC rates are:
- Google Search: $4.22
- Google Display: $0.63
- Microsoft Search: $1.54
Click-Through Rate (CTR)
The fact that your ad displays doesn’t mean that the user will click it. People are influenced by many things, like whether your ad relates to what they want to accomplish and if your ad copy resonates with them. Certain factors that are mainly up to the ad platform, such as whether your extensions and images display influence clicks, too. Each time someone clicks your ad, it’s referred to as a “click-through” or CTR because they’re clicking through to your landing page.
Generally speaking, a higher CTR is better. It means your messaging is spot-on and reaching the right people.
CTR Benchmarks
You’ll see wide variances in average CTRs across industries, too. In this case, law comes out at the bottom, with just 4.76% of users clicking through. Arts and entertainment comes out on top at 11.78%.
Across all industries, average CTRs are:
- Google Search: 6.11%
- Google Display: 0.46%
- Microsoft Search: 2.83%
Conversion Rate (CVR)
The next major consideration is whether the user completes the action you wanted. That might mean they filled out a lead generation form, made a purchase, or simply provided you with contact information so that they could access content. The number of users who complete your desired action in relation to the total users who clicked through is referred to as a conversion rate or CVR. It’s represented as a percentage.
Again, a higher CVR is usually better. It signifies that you’re creating a cohesive user experience and carrying them through the customer journey well.
CVR Benchmarks
Average CVRs vary from 1.57% in the fashion industry all the way up to 13.41% for businesses that specialize in animals or pets.
Across all industries, average CVRs are:
- Google Search: 7.04%
- Google Display: 0.77%
- Microsoft Search: 2.94%
Cost Per Lead (CPL) / Cost Per Action (CPA)
A final benchmark to track is how much it costs you to get that conversion. If your goal is lead generation, you’ll track it as cost per lead or CPL. If your goal is something else, it’s usually referred to as cost per action or CPA. This differs from cost per acquisition or your business’s total cost to secure a new customer. Your PPC CPA only considers the cost of the ads you’re running. If you’re calculating acquisition costs, you’ll also include other costs, such as labor expenses, as your sales team engages with the lead.
A low CPL is best. It suggests your PPC campaigns are set up well and means you’ll squeeze more leads out of your budget, increasing your ROI.
CPL Benchmarks
Sometimes, businesses get a bit of sticker shock when they see CPL averages. However, if you’ve done your homework and already know your customer lifetime value (CLV), it’s easy to see how seemingly high CLVs are a drop in the bucket compared to how much a customer brings in during their time with you. Attorneys are a prime example. The average CPL for law is $111.05. Yet, the typical legal client will easily spend thousands, if not tens of thousands of dollars. Other industries start at around $20.
Across all industries, CPL averages are:
- Google Search: $53.52
- Google Display: $75.51
- Microsoft Search: $41.44
PPC Benchmarks by Industry
As we touched on earlier, PPC benchmarks vary by industry. Because of this, it’s important to benchmark yourself against businesses that are similar to yours. Below, we’ll cover a few industries that leverage PPC advertising, benchmarks for each, and some factors that influence them.
Business and Professional Services PPC Benchmarks
Professionals such as accountants, architects, consultants, and engineers fit within the business and professional services industry. If you’re a professional services provider, you’ll usually see CTRs and CVRs than average because the buying process is longer and often involves more people. Your costs will be a bit higher too.
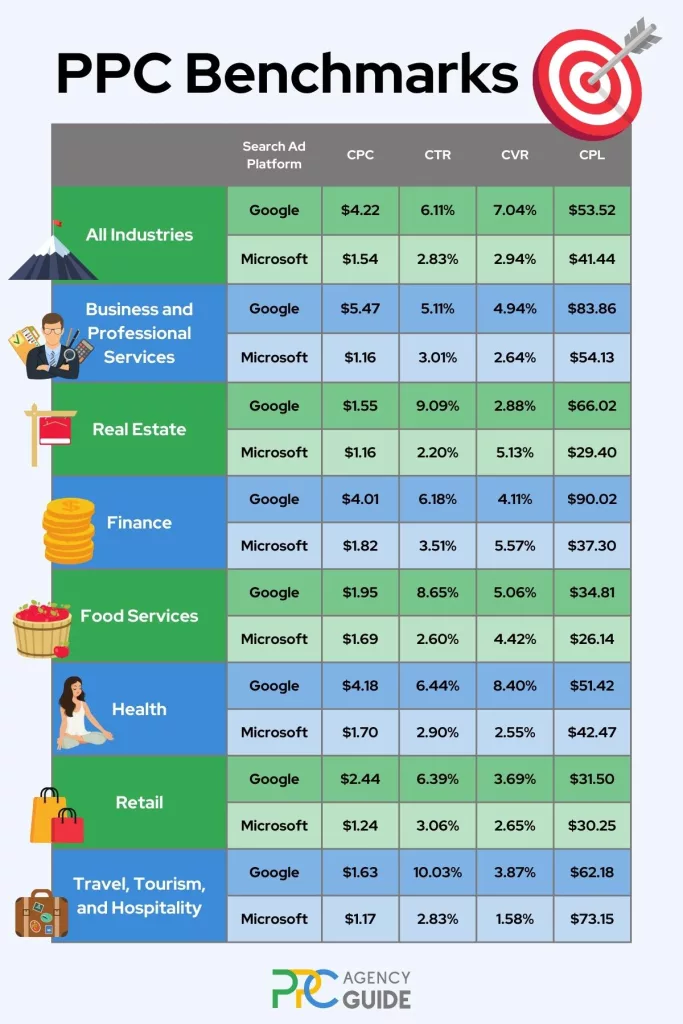
- Google Search – CPC: $1.55 | CTR: 5.11% | CVR: 4.94% | CPL: $83.36
- Microsoft Ads Search – CPC: $1.16 | CTR: 3.01% | CVR: 2.64% | CPL: $54.13
Real Estate PPC Benchmarks
Your CPC and CTR should be lower than average if you’re in the real estate industry. However, there’s a firm divide on conversions depending on the advertising platform you’re using. Google Search has a much lower CTR than the average for your industry, which sends the CPL higher. Microsoft has a higher CVR, so CPL is lower than average. In fact, if you’re working with both platforms, your Microsoft CPL should be less than half of your Google CPL.
- Google Search – CPC: $1.55 | CTR: 9.09% | CVR: 2.88% | CPL: $66.02
- Microsoft Ads Search – CPC: $2.88 | CTR: 2.20% | CVR: 5.13% | CPL: $29.40
Finance PPC Benchmarks
Banks, credit unions, FinTech companies, and others in the finance industry sit very close to average rates for CPC and CTR. However, we see the same pattern here that we do with real estate in that CVR is lower than average on Google Search and higher than average on Microsoft. This may be because people who use Bing, the Microsoft search engine, are typically more educated and more affluent, per WordStream research. This means businesses that traditionally target people within those demographics will have an easier time reaching their ideal customers on Bing, even if they don’t use precise targeting methods.
- Google Search – CPC: $4.01 | CTR: 6.18% | CVR: 4.11% | CPL: $90.02
- Microsoft Ads Search – CPC: $1.82 | CTR: 3.51% | CVR: 5.57% | CPL: $37.30
Food Services PPC Benchmarks
Benchmarks for the food services industry are lower than average. This is mainly because most businesses in the industry serve a small demographic area, and PPC is underutilized, which results in less competition. Although the average CPL sits around $30, it’s crucial to consider customer lifetime value. If you have systems in place to encourage repeat business, then you’ll easily turn a profit in the weeks, months, and years that follow.
- Google Search – CPC: $1.95 | CTR: 8.65% | CVR: 5.06% | CPL: $34.81
- Microsoft Ads Search – CPC: $1.69 | CTR: 2.60% | CVR: 4.42% | CPL: $26.14
Healthcare PPC Benchmarks
The healthcare industry is unique. If you operate a health, fitness, or wellness-related business, such as a gym, studio, or supplement company, your PPC KPIs fall relatively close to general averages. However, if you’re managing PPC for a physician or dentist, there will be more variances. Dentists, for example, should see much higher conversion rates but be prepared for a higher CPL due to increased competition and a higher CPC.
- Google Search – Health and Fitness – CPC: $4.18 | CTR: 6.44% | CVR: 8.40% | CPL: $51.42
- Google Search – Physicians and Surgeons – CPC: $3.97 | CTR: 6.73% | CVR: 13.12% | CPL: $37.71
- Google Search – Dentists: CPC: $6.69 | CTR: 5.34% | CVR: 10.40% | CPL: $65.37
- Microsoft Ads Search – Health and Wellness – CPC: $1.70 | CTR: 2.90% | CVR: 2.55% | CPL: $42.47
Retail PPC Benchmarks
If you’re in the retail industry, your CPC should be lower than average, and your CTR should be higher, bringing your CPL to a lower-than-average rate.
- Google Search – CPC: $2.44 | CTR: 6.39% | CVR: 3.69% | CPL: $31.50
- Microsoft Ads Search – CPC: $1.24 | CTR: 3.06% | CVR: 2.65% | CPL: $30.25
Travel, Tourism, and Hospitality PPC Benchmarks
Those in travel, tourism, and hospitality are in a unique situation because their customers are almost always spending discretionary funds and often have a longer journey with more touchpoints. Potential customers are unlikely to sign up for your services or make a booking immediately and are likelier to do comparison shopping. This shows in the benchmarks because, although CPC is low and CTR is high, conversions are low, and CPL is high. PPC ads can still pay off, even with a high CPL, but you need a solid strategy to nurture leads as well.
- Google Search – CPC: $1.63 | CTR: 10.03% | CVR: 3.87% | CPL: $62.18
- Microsoft Ads Search – CPC: $1.17 | CTR: 2.83% | CVR: 1.58% | CPL: $73.15
What to Do When You Don’t Meet PPC Benchmarks
If you’ve reviewed PPC benchmarks for your industry and you’re not performing as well as your peers, there are ways to improve your results.
Troubleshooting a High Cost Per Click
If your CPC is higher than your peers, it can’t be attributed to competition. Instead, it means your ad is displaying for people who aren’t good candidates for what you do, and they click on it. The following tips can help you maximize your PPC marketing budget.
Perform Keyword Research
If you haven’t done so already, perform keyword research and run ads only for terms that fit your brand and relate to the action you want the user to take.
Use Negative Keywords
Review the search terms that are triggering your ads to display regularly. Add any that aren’t a good fit to your negative keyword list.
Cull Poor Performers
If specific terms, ad groups, or campaigns have an abnormally high CPC, pause them and conserve your budget for those that perform better.
Improve Your Quality
You can get top-tier placement with a lower bid if the advertising platform believes you’re providing a superior experience compared to your peers. Strengthen your ad quality score by using high-quality landing pages, creating a seamless experience, and ensuring each step retains the same relevance to the user.
Troubleshooting a Low Click-Through Rate
A low click-through rate generally means your ad isn’t relevant and compelling to the person reading it.
Use Personas
Your PPC personas represent real people who might view your ads. If you keep a specific persona in mind as you develop your assets, they’ll resonate with your readers more, and your ads will get more clicks.
Craft Quality Copy
Make sure you’re following best practices for ad copy. Include keywords and power words. Experiment with different offers and CTAs to see what resonates.
Improve Targeting
Even the best ads won’t perform well if they’re being seen by people who will never take action. Think beyond targeting for location, age, and gender.
Troubleshooting a Low Conversion Rate
A low conversion rate means people click your ad but do not follow through on the action you want them to take. Again, some industries have lower conversion rates because people research more or the investment is high. However, if your CVR is lower than your peers, people are likely dissatisfied or underwhelmed by what they find when they click your ad.
Use Landing Pages
Don’t send people to your homepage. Send them to a special landing page designed to help them convert.
Be Consistent
Ensure people see the same messaging at every stage to build familiarity and confidence.
Speed Things Up
Keep your landing pages light. Aim to have them load within three seconds.
Boost Confidence
Use trust signals to send subconscious signals that your brand is reputable. Refer to your personas to see what concerns might stop your reader from moving forward and address them in your copy.
Make it Easy
The fewer steps someone has to take and the less information they need to give you, the more likely they are to complete an action.
Troubleshooting a High Cost Per Lead
You’ll usually only see a high CPL if one of the other areas is off. Address CPC, CTR, and CVR issues using the techniques above to improve your CPL. Additionally, you may want to move more of your budget to Microsoft Ads, as costs are lower for most industries on the platform.
Get Help Meeting or Exceeding Your PPC Benchmarks
Brands with PPC campaigns that perform exceptionally well don’t just set them up and leave them. They constantly review the data and make minor adjustments to improve their results. If you don’t have the resources to manage this internally or you’ve tried without success, it may be time to bring on a pro. An experienced PPC agency will evaluate your ads and continuously improve them so you’re always getting the best possible ROI. To learn more or get started, request a complimentary consultation.
Data Credit: Unless otherwise specified, Google Display, Google Search, and Microsoft Search data was all sourced from WordStream.